NewRelic causing OutOfMemoryError in Play Framework app
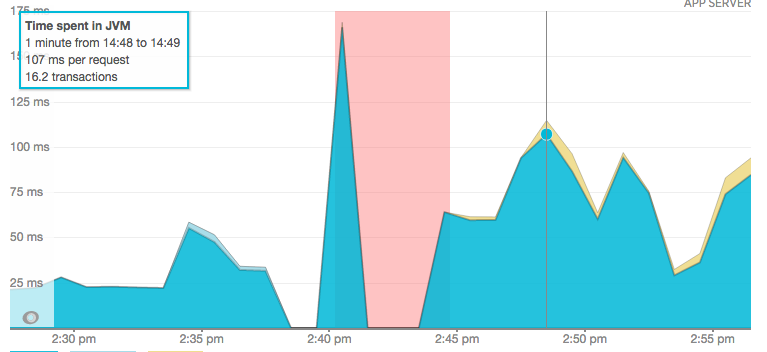
Today I disabled the NewRelic JVM agent on one of my projects. While the Play Framework server was outputting a ZipOutputStream to a client, the NewRelic agent would for some reason gather massive amounts of data and cause the JVM to Garbage Collect continuously until the app became unresponsive, and finally crashed:
Uncaught error from thread [play-akka.actor.default-dispatcher-33] shutting down JVM since 'akka.jvm-exit-on-fatal-error' is enabled for ActorSystem[play]
java.lang.OutOfMemoryError: GC overhead limit exceeded
Uncaught error from thread [play-scheduler-1] shutting down JVM since 'akka.jvm-exit-on-fatal-error' is enabled for ActorSystem[play]
java.lang.OutOfMemoryError: GC overhead limit exceeded
[ERROR] [02/27/2015 14:45:10.002] [application-scheduler-1] [ActorSystem(application)] exception on LARS? timer thread
java.lang.OutOfMemoryError: GC overhead limit exceeded
Since september I had been using NewRelic’s v3.10.0 agent. The specific zip streaming that was causing the issue was a feature supposed to be used starting Februari 27, but of course the feature was tested before. Both locally and in production the feature seemed to work, for smaller amounts of files. However in production the typical amount of files in the zip would be more than 1000 each of them ranging from several KB to 0.5MB. As soon as we discovered the issues we started delving into what could have caused the symptoms: a server that would not handle anymore requests, using 100% CPU and it maximum allowed memory size (-Xmx1024m). We did refactor the complete logic responsible for serving the zip‘s, but to no avail. Locally the new method seemed better: now the zipping would not continue to use resources after the request would be closed prematurely. We also wrote a test that would simulate zipping random files, this also worked, locally.
Locally however, no NewRelic was installed. How could a service responsible for showing problems ever be the cause of the problems, we thought.
It now being past Februari 27, the zip streaming had been enabled for our users. We saw an immediate increase in downtime: the server would hang, we would ironically get an e-mail from NewRelic, and we would restart the server. Of course the logs directed us to the culprit: the initiation of a zip stream was always the last action before the downtime.
This weekend I decided to investigate, and learned all new tricks. Having never done a Heap Dump before this felt quite tricky at first, but in the end it was very easy:
ssh server “ps x | grep play”
ssh server “sudo -u play jmap -dump:file=/dump.hprof”
scp server:/dump.hprofOpen dump with Eclipse’s MemoryAnalyser
Eclipse Memory Analyser is a free tool that is very easy to use. It starts importing your dump file (which is way faster in Run in Background mode!) and then shows really helpful statistics:
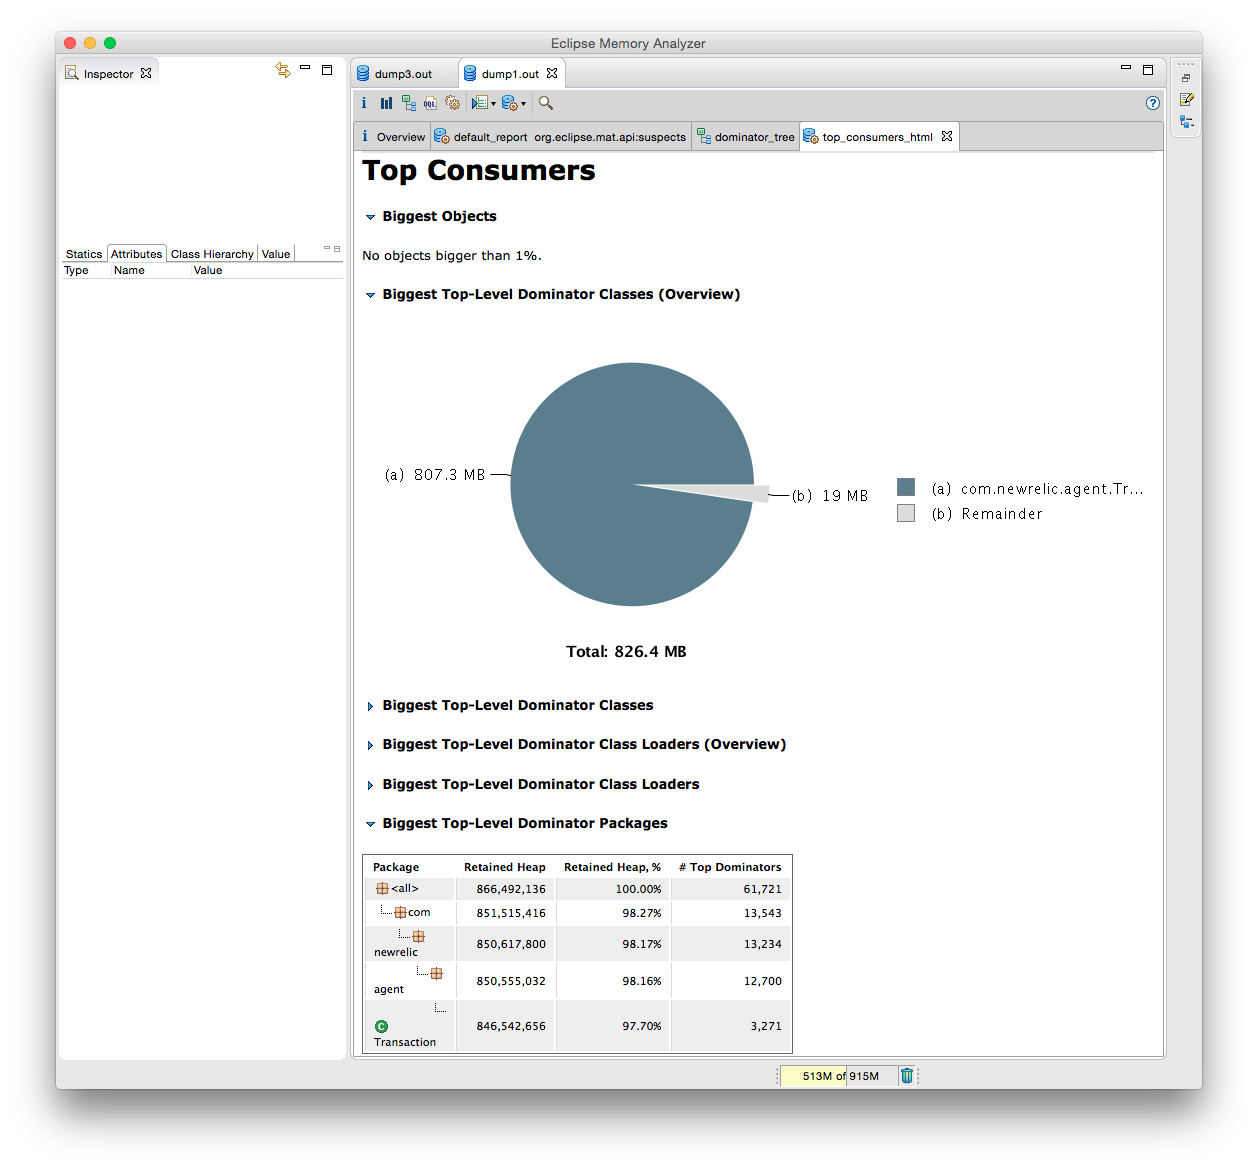
After seeing this analysis I was baffled: how could this be? So I searched and found this thread on the New Relic forum from October 2014. More people had this issue! In December they released version 3.12.1 which has the following release notes:
Improvements
- Play 2 async activity is no longer tracked when transaction is ignored.
- Reduced GC overhead when monitoring Play 2 applications.
- Reduced memory usage when inspecting slowest SQL statements
[..]
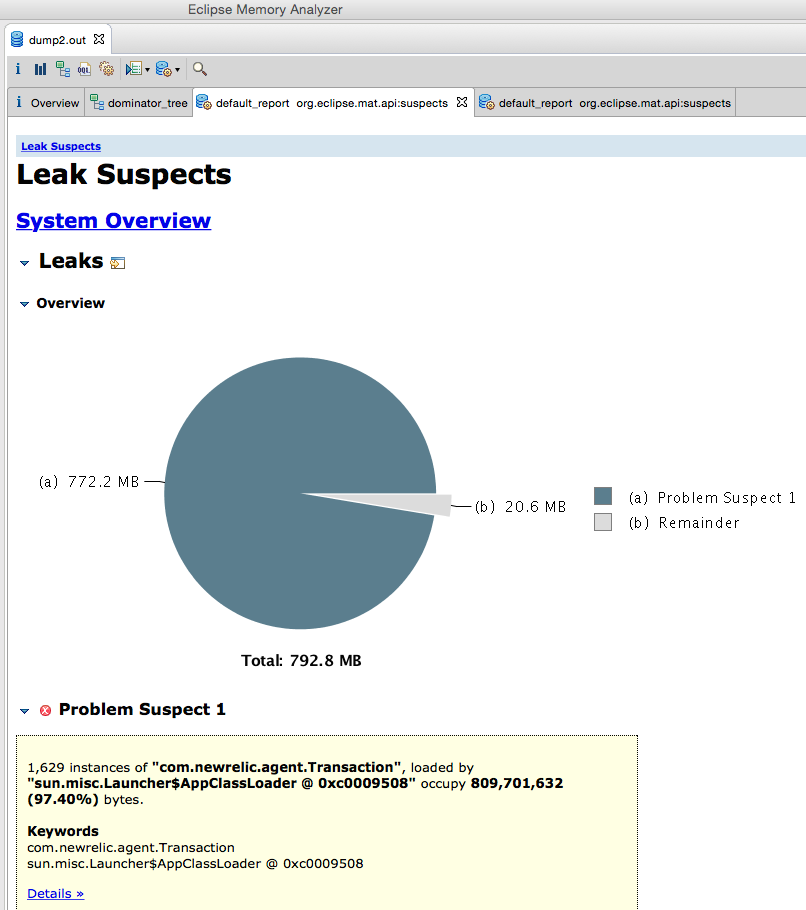
… they said. So I updated to a new version of the agent. It did not work. The server would still hang caused by the many Transactions stored in the queue. New statistics:
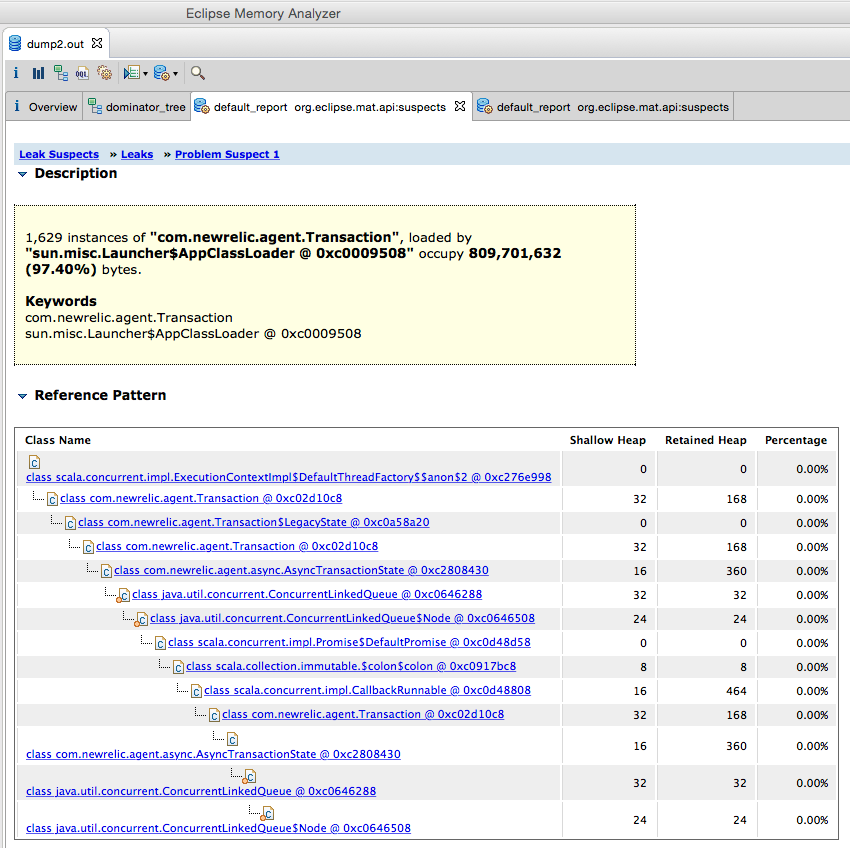
Too bad that the update did not fix the issue. I hope that NewRelic can fix the issue in the future, as I really liked the assurance that you get mails when your server is down, but also being able to drill down into performance issues. By the way: besides the issue still being there, also the apps performance decreased when using the updated agent: